Interpolation

convinterp against SciPy and NumPy

How accurately convinterp reproduces a difficult function from uniformly spaced samples, compared with SciPy’s cubic spline and with Chebyshev interpolation, and how fast it evaluates compared with SciPy’s interpolators in one and two dimensions.

Accuracy

Runge’s function, f(x) = 1/(1 + 25x^2) on [-1, 1], is smooth but notoriously difficult for polynomial interpolation on uniform grids. Figure 1 shows the maximum error over a dense set of test points as the number of uniformly spaced samples grows.

Code
import numpy as np                                     # arrays and Chebyshev evaluation
import matplotlib.pyplot as plt                        # plotting
from scipy.fft import dct                              # fast cosine transform, for Chebyshev coefficients
from scipy.interpolate import CubicSpline              # cubic spline reference
from convinterp import convolution_interpolation       # the package under test


def runge(x):
    # Runge's function: smooth, but hard for polynomial interpolation on uniform grids
    return 1.0 / (1.0 + 25.0 * x**2)


def chebyshev_coefficients(f, n):
    # coefficients of the interpolant of f at the n Chebyshev points of the first kind,
    # by a type-II DCT (stable and O(n log n))
    j = np.arange(n)                                                 # node indices 0 … n−1
    nodes = np.cos(np.pi * (j + 0.5) / n)                            # Chebyshev points of the first kind
    coefs = dct(f(nodes), type=2) / n                                # c_k = (2/n) Σ_j f(x_j) cos(πk(j + ½)/n)
    coefs[0] /= 2                                                    # the constant term has half weight
    return coefs


def convergence_study():
    x_test = np.linspace(-1.0, 1.0, 11_001)                          # dense test points
    y_test = runge(x_test)                                           # exact values there
    ns = np.unique(np.logspace(1, 4, 100).astype(int))               # 10 … 10000 samples, log-spaced
    kernels = ["a4", "b5", "b7", "b9", "b11", "b13"]                 # the kernels compared

    errors = {k: [] for k in kernels}                                # max error per kernel, per n
    spline_errors = []                                               # max error of the cubic spline
    cheb_errors = []                                                 # max error of Chebyshev interpolation

    for n in ns:
        x = np.linspace(-1.0, 1.0, n)                                # uniform grid with n samples
        y = runge(x)                                                 # the data on it
        for k in kernels:
            itp = convolution_interpolation(x, y, kernel=k)          # default boundary condition "detect"
            errors[k].append(np.max(np.abs(itp(x_test) - y_test)))   # maximum absolute error
        spline = CubicSpline(x, y)                                   # not-a-knot cubic spline
        spline_errors.append(np.max(np.abs(spline(x_test) - y_test)))
        coefs = chebyshev_coefficients(runge, n)                     # its own n non-uniform points
        cheb_errors.append(np.max(np.abs(np.polynomial.chebyshev.chebval(x_test, coefs) - y_test)))

    fig, ax = plt.subplots(figsize=(10, 6.5))                        # one log-log axis
    ax.loglog(ns, spline_errors, lw=2.5, color="orange", label="Cubic spline (SciPy)")
    for k in kernels:
        ax.loglog(ns, errors[k], lw=2, label=f'"{k}"')               # one line per convinterp kernel
    ax.loglog(ns, cheb_errors, lw=2.5, color="blue", label="Chebyshev (non-uniform points)")
    ax.loglog(ns, 1e-5 * (100.0 / ns) ** 7, "k--", lw=2, label=r"$\mathcal{O}(h^7)$")  # reference slope
    ax.set_xlim(10, 1e4)
    ax.set_ylim(1e-16, 1e0)
    ax.set_xlabel("Number of sample points")
    ax.set_ylabel("Maximum absolute error")
    ax.grid(True, which="both", alpha=0.3)                           # light grid for reading slopes
    ax.legend(loc="lower left")
    fig.tight_layout()
    return fig


fig = convergence_study()
plt.show()
Figure 1: Maximum interpolation error for Runge’s function. The kernels “b7” to “b13” converge at 7th order and “b5” at 6th, down to rounding; “a4” matches a cubic spline at 4th order. Chebyshev interpolation, shown for reference, requires its own non-uniform sample points.

The kernels "b7" to "b13" follow the dashed \mathcal{O}(h^7) line until they reach the limit of double-precision arithmetic, the wider kernels first. "b5" converges at 6th order, which shows as a slightly higher curve that approaches the others at the floor. The kernel "a4" converges at 4th order, like the cubic spline. Chebyshev interpolation converges faster than any fixed order, but only because it chooses its own sample points, clustered towards the ends of the interval. On uniformly sampled data, such as measurements, simulations and images, it cannot be used; there, the realistic alternative is a spline.

Evaluation speed

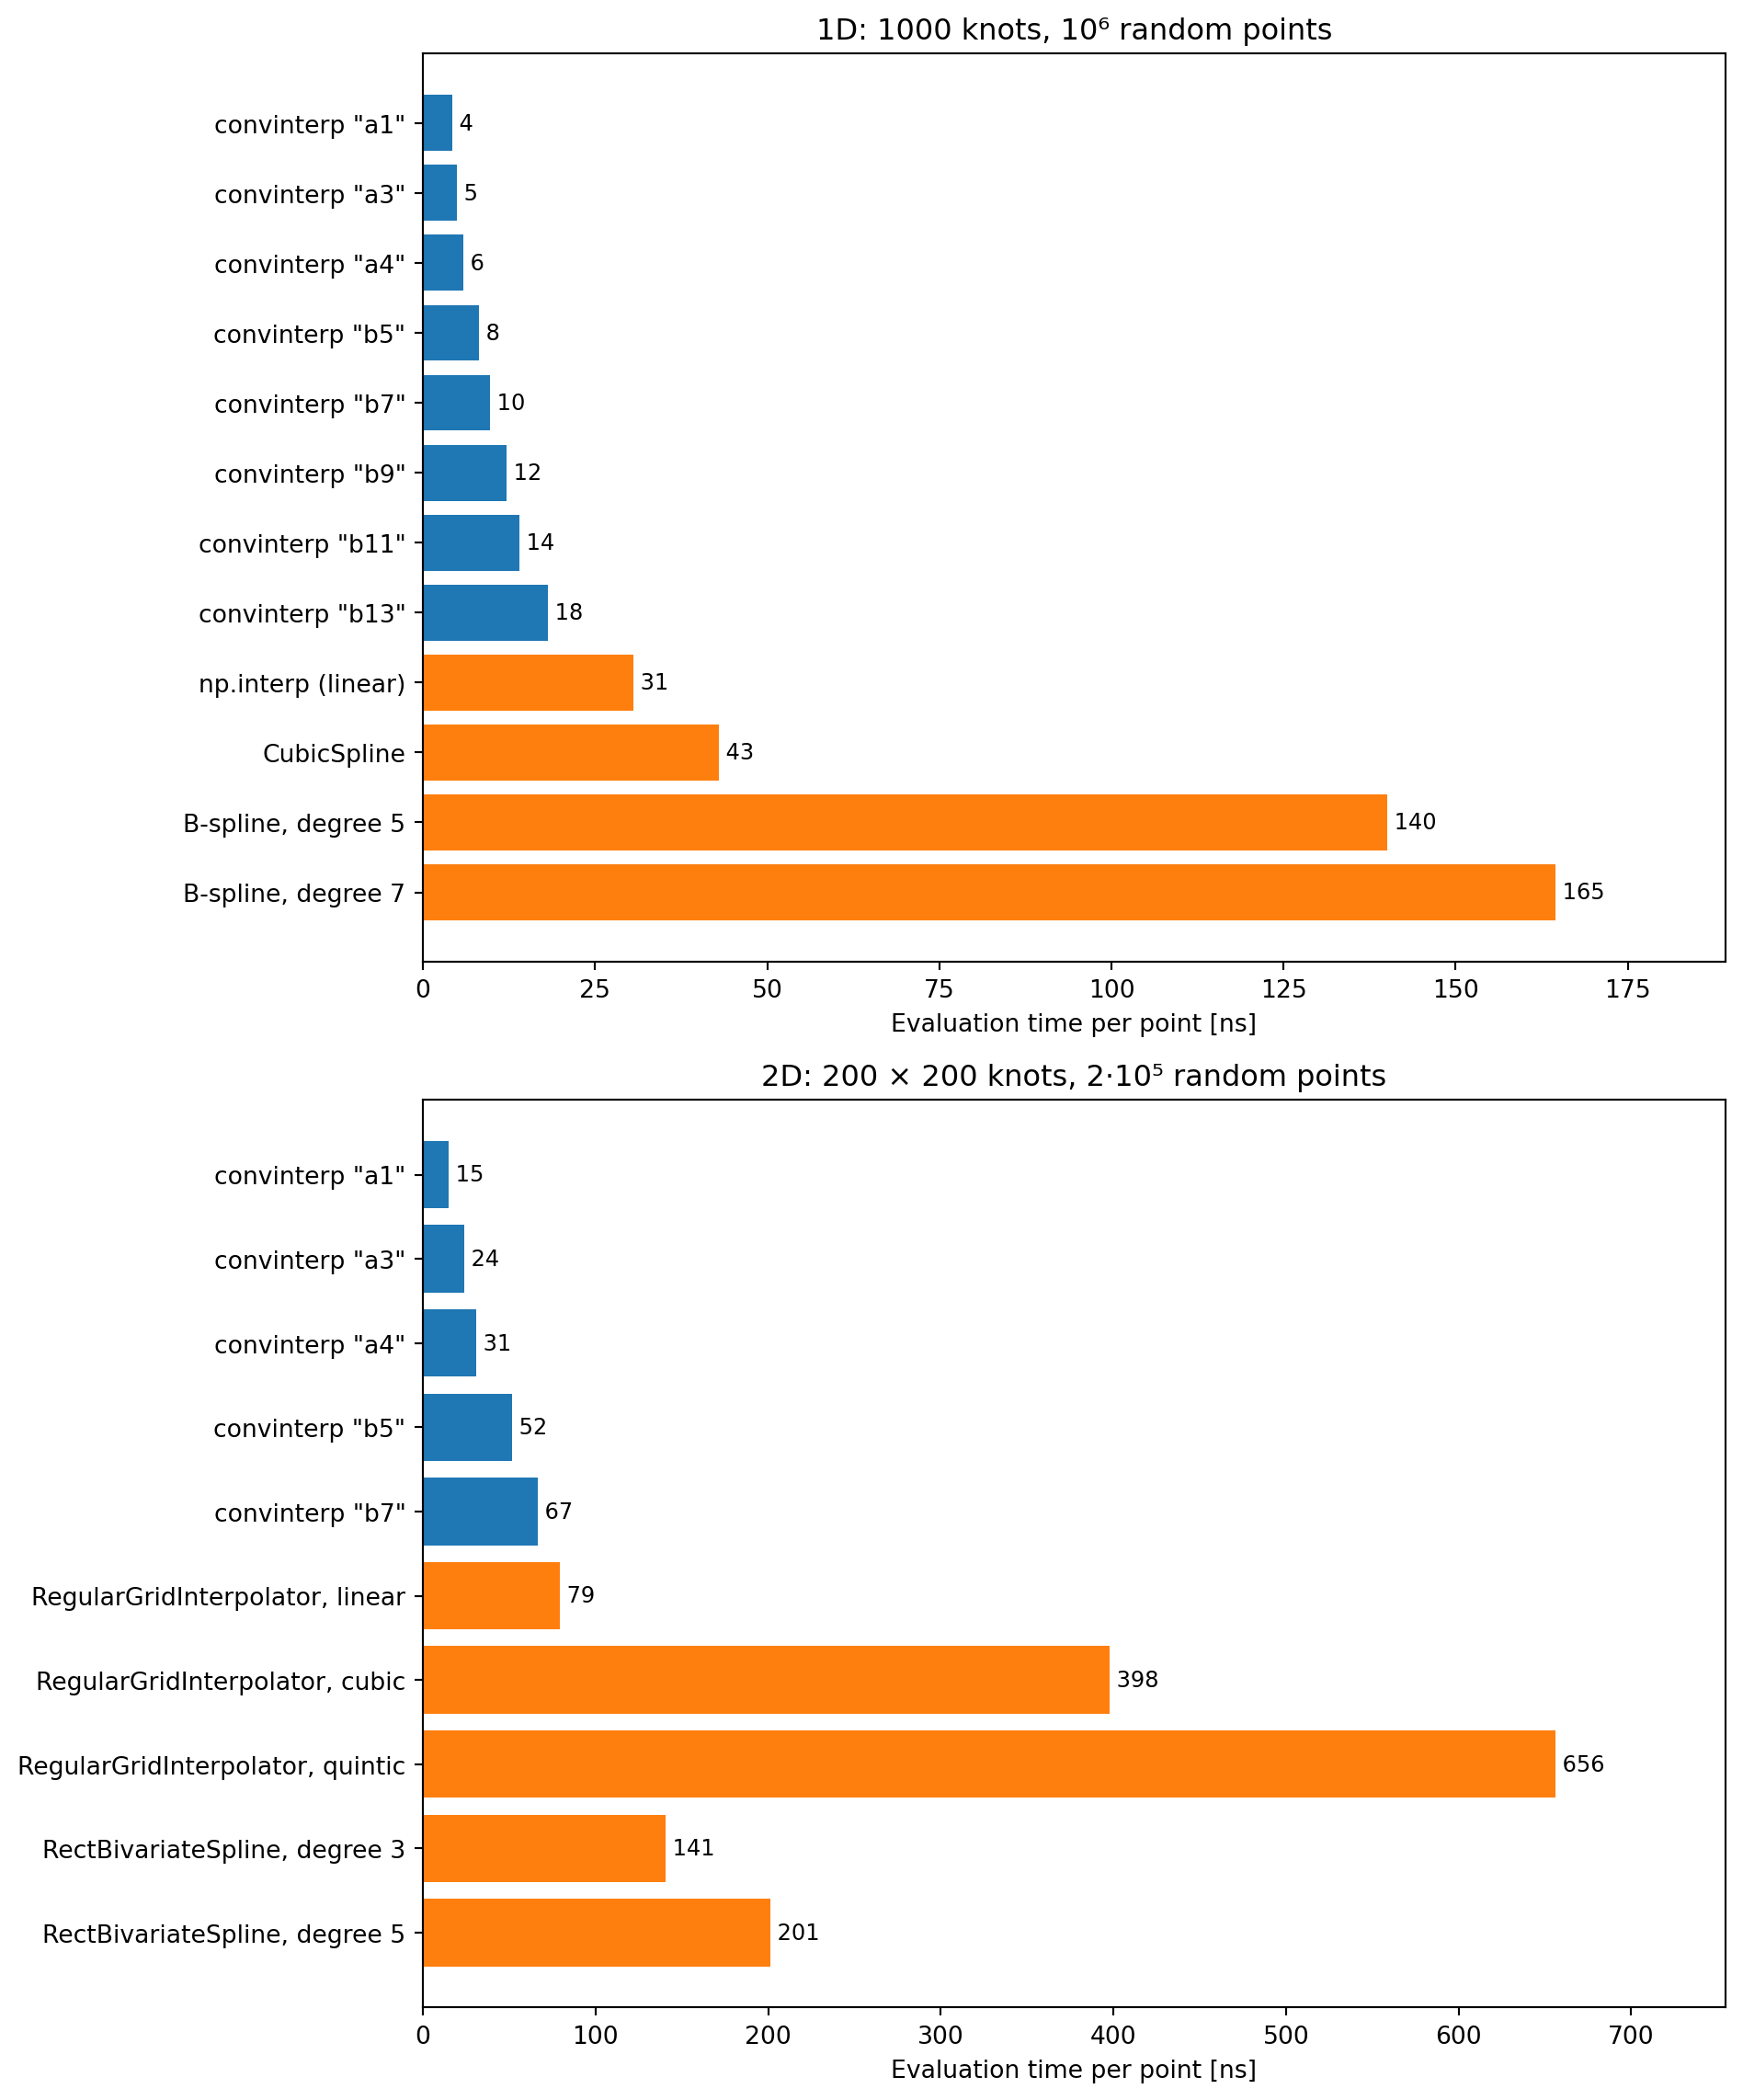
Figure 2 compares the time per evaluated point with SciPy’s standard interpolators, in 1D and 2D. Every interpolant is built before the timing starts, and all points are evaluated in one vectorized call, taking the fastest of five runs.

Code
import time                                            # wall-clock timing
from scipy.interpolate import make_interp_spline, RegularGridInterpolator, RectBivariateSpline


def ns_per_point(evaluate, n_points, repeats=5):
    # the best of `repeats` timings of one vectorized call, in nanoseconds per point
    best = np.inf                                                    # fastest run so far
    for _ in range(repeats):
        start = time.perf_counter()                                  # high-resolution clock
        evaluate()                                                   # evaluate at all points at once
        best = min(best, time.perf_counter() - start)                # keep the fastest run
    return 1e9 * best / n_points                                     # seconds per call → ns per point


def timing_1d(n_knots=1000, n_points=1_000_000):
    # evaluation time per point in 1D, at random (unsorted) points
    rng = np.random.default_rng(0)                                   # reproducible points
    x = np.linspace(0.0, 1.0, n_knots)                               # uniform grid
    y = np.sin(8.0 * x) + 0.3 * x                                    # smooth data on it
    p = rng.uniform(0.0, 1.0, n_points)                              # the evaluation points
    convinterp, scipy = {}, {}                                       # ns per point, by method
    for k in ["a1", "a3", "a4", "b5", "b7", "b9", "b11", "b13"]:
        itp = convolution_interpolation(x, y, kernel=k)              # built once, outside the timing
        convinterp[f'"{k}"'] = ns_per_point(lambda: itp(p), n_points)
    scipy["np.interp (linear)"] = ns_per_point(lambda: np.interp(p, x, y), n_points)
    spline = CubicSpline(x, y)                                       # cubic spline
    scipy["CubicSpline"] = ns_per_point(lambda: spline(p), n_points)
    for degree in (5, 7):
        bspline = make_interp_spline(x, y, k=degree)                 # interpolating B-spline
        scipy[f"B-spline, degree {degree}"] = ns_per_point(lambda: bspline(p), n_points)
    return convinterp, scipy


def timing_2d(n_knots=200, n_points=200_000):
    # evaluation time per point in 2D, at random points on a 200 × 200 grid
    rng = np.random.default_rng(1)                                   # reproducible points
    x = np.linspace(0.0, 1.0, n_knots)                               # knots of axis 0
    y = np.linspace(0.0, 1.0, n_knots)                               # knots of axis 1
    data = np.sin(8.0 * x)[:, None] * np.cos(5.0 * y)[None, :]       # smooth data on the grid
    px = rng.uniform(0.0, 1.0, n_points)                             # x coordinates of the points
    py = rng.uniform(0.0, 1.0, n_points)                             # y coordinates of the points
    pxy = np.column_stack([px, py])                                  # the same points as rows, for SciPy
    convinterp, scipy = {}, {}                                       # ns per point, by method
    for k in ["a1", "a3", "a4", "b5", "b7"]:
        itp = convolution_interpolation((x, y), data, kernel=k)      # built once, outside the timing
        convinterp[f'"{k}"'] = ns_per_point(lambda: itp(px, py), n_points)
    for method in ["linear", "cubic", "quintic"]:
        rgi = RegularGridInterpolator((x, y), data, method=method)   # SciPy's grid interpolator
        scipy[f"RegularGridInterpolator, {method}"] = ns_per_point(lambda: rgi(pxy), n_points)
    for degree in (3, 5):
        rbs = RectBivariateSpline(x, y, data, kx=degree, ky=degree)  # tensor-product spline
        scipy[f"RectBivariateSpline, degree {degree}"] = ns_per_point(
            lambda: rbs(px, py, grid=False), n_points)               # grid=False: evaluate point by point
    return convinterp, scipy


def bar_panel(ax, convinterp, scipy, title):
    # horizontal bars: convinterp kernels on top, SciPy methods below, with the times written out
    labels = [f"convinterp {k}" for k in convinterp] + list(scipy)   # one bar per method
    times = list(convinterp.values()) + list(scipy.values())         # ns per point, same order
    colors = ["tab:blue"] * len(convinterp) + ["tab:orange"] * len(scipy)
    rows = np.arange(len(labels))                                    # one row per bar
    ax.barh(rows, times, color=colors)
    ax.set_yticks(rows, labels)
    ax.invert_yaxis()                                                # first entry at the top
    for row, t in zip(rows, times):
        ax.text(t, row, f" {t:.0f}", va="center", fontsize=9)        # the time next to each bar
    ax.set_xlim(0, 1.15 * max(times))                                # room for the labels
    ax.set_xlabel("Evaluation time per point [ns]")
    ax.set_title(title)


def timing_figure():
    c1, s1 = timing_1d()                                             # 1D timings
    c2, s2 = timing_2d()                                             # 2D timings
    fig, (ax1, ax2) = plt.subplots(2, 1, figsize=(10, 12))           # 1D and 2D, stacked
    bar_panel(ax1, c1, s1, "1D: 1000 knots, 10⁶ random points")
    bar_panel(ax2, c2, s2, "2D: 200 × 200 knots, 2·10⁵ random points")
    fig.tight_layout()
    return fig


fig = timing_figure()
plt.show()
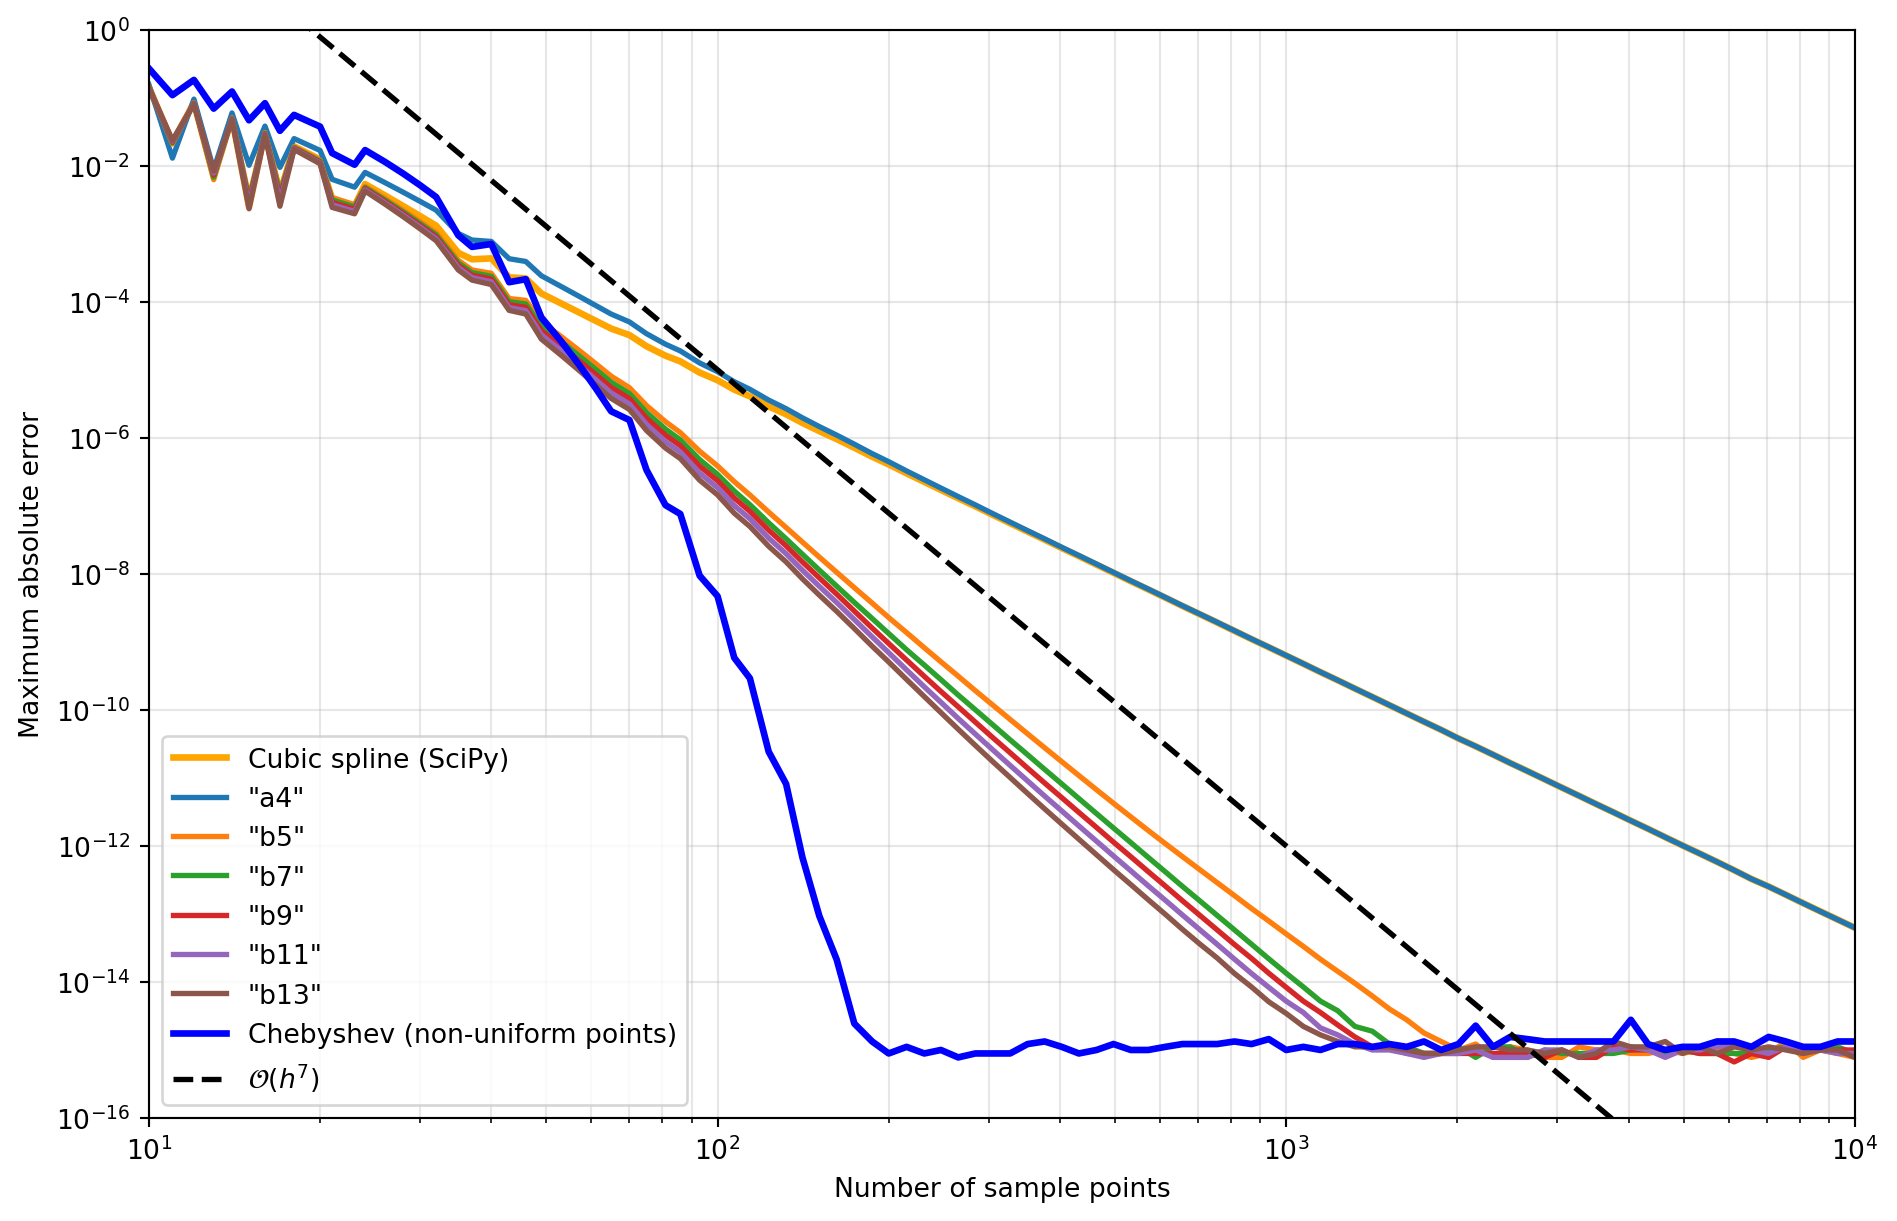
Figure 2: Evaluation time per point, convinterp (blue) and SciPy (orange). Top: interpolation in 1D; bottom: in 2D. Measured on the machine that built this page, at build time: absolute times vary between machines, but the ratios between methods are what matters.

On a uniform grid, locating a point takes a single division, where SciPy’s general-purpose interpolators search the knots. The kernel weights are exact polynomials, evaluated for the whole stencil at once in compiled, vectorized Rust. The bars show what that is worth: compare "a4" with the cubic spline, and the b-series kernels with the degree-5 and degree-7 splines, at comparable orders of accuracy.